Build a Map from an RSS Feed
For this guide, we’ll go through a real-world use case. The non-profit BikeLoud PDX wanted to build a way to display issues from PDX Reporter on a map. The City of Portland used to provide this, but stopped doing so.
This type of thing seems, and should be, simple, but can quickly get out of hand.
Using WebhookDB, BikeLoud was able to break down the work into three straightforward pieces:
- Use WebhookDB to replicate the PDX Reporter RSS feed into a database.
- Build a query against that database to get data to render markers.
- Serve a static webpage with the map.
Find the UI code for this tutorial at https://github.com/webhookdb/pdxreporter-map.
Replicate the RSS feed
PDX Reporter has an RSS feed at https://www.portlandoregon.gov/shared/cfm/trackit_devicerss.cfm. It serves the last 100 reports.
We can replicate this feed into WebhookDB. This allows us to query the feed with SQL, but it also stores reports in perpetuity, allowing us access to the full reporting history rather than just the last 100.
- Go to https://api.webhookdb.com/terminal.
- Log in:
webhookdb auth login - After you log in, replicate the RSS feed:
webhookdb integrations create atom_single_feed_v1. - It will prompt you for the URL. Enter
https://www.portlandoregon.gov/shared/cfm/trackit_devicerss.cfm. - The CLI will output your connection string. You can use this in your SQL editor.
- If you have the
webhookdbexecutable (see </docs/getting-started/install-cli.html>), you can usepsql `webhookdb db connection`to get the connection URL and connect to it usingpsql.
Build your query
Our query should select all the data we need, in the format we want to display it. For example:
- Columns like
title,geo_lat, andgeo_lngcan be used as-is. - We can use the
timezone()andto_char()functions to convert thepublishedcolumn to what we want to display (we do not need to use client-side time formatting since we are dealing with a single city).
However, the feed has some structured data stored in the content field, as HTML. It has content like <dl><dd>Address</dd><dt>123 MAIN ST</dt><dd>Comment</dd><dt>Gravel in bike lanes.</dt></dl>.
We need to extract this from HTML, into cleaned fields in the SELECT query.
We could do this in JavaScript on the client. But in our opinion, it’s a lot simpler to do it with the database query. There’s less code, iteration is faster, and let’s face it, vanilla JavaScript can be really annoying to use.
but it will make the client code less portable; one of the nice aspects of doing this in the query is that, we can modify the SQL, which is like modifying the backend, without requiring changes to the client.
This query looks worse than it is; it involves some string munging to turn HTML into XML, and then some XPath, which would be the same in any language. The code on the client would be similar, if more verbose.
Here is the final SQL we can use to get all our structured map marker data:
Make sure you use the table name from your replicator, not the one hard-coded here! It will have been output after you created your replicator, or you can use webhookdb integration info atom_single_feed_v1.
WITH n AS (
SELECT (
-- html may have no root, xml must have a single one
'<root>' ||
-- Make sure <img> tag has a closing tag
replace(
-- Strip leading whitespace
regexp_replace(
-- strip trailing whitespace
regexp_replace(
-- replace <dl>, <dd>, and <dt> opening tags.
-- We cannot just replace < and > everywhere since they may be used in a comment.
replace(
replace(
replace(
-- replace </dl>, </dd>, and </dt>.
replace(
replace(
replace(
-- replace img opening tag
replace(data -> 'content' ->> 'value', '<img ', '<img '),
'</dt>', '</dt>'),
'</dd>', '</dd>'),
'</dl>', '</dl>'),
'<dt>', '<dt>'),
'<dd>', '<dd>'),
'<dl>', '<dl>'),
E'^[\n\s\t]*', ''),
E'[\n\s\t]*$', ''),
'width=200&height=200"&', 'width=200&height=200"></img>'
) ||
'</root>')::xml AS contentxml,
title,
to_char(timezone('America/Los_Angeles', published), 'FMDy Mon FMDD, YYYY FMHH:MI am') as published,
published as timestamp,
geo_lat,
geo_lng,
entry_id,
data->>'status' AS status,
data->'category'->>'term' as category
FROM pdxreporterrss
)
(
SELECT
title,
published,
geo_lat,
geo_lng,
status,
category,
entry_id,
(xpath(E'/root/dl/dt[text()=\'Address\']/following-sibling::dd[1]/text()', contentxml)::text[])[1] as address,
(xpath(E'/root/dl/dt[text()=\'Comments\']/following-sibling::dd[1]/text()', contentxml)::text[])[1] as comment
FROM n
ORDER BY timestamp DESC
LIMIT 1000
);
Create the saved query
Now that we have our SQL, we can create the query. Copy the SQL you wrote, then create the saved query, pasting your query when prompted for the SQL:
$ webhookdb saved-query create
What is the query used for? PDX Reporter Map
Enter the SQL you would like to run:
Make it public (make note of your saved query ID, starting with svq_):
$ webhookdb saved-query update --field=public --value=true svq_m7c4zgy4sfza0eqwic7wqavc
You have updated saved query svq_m7c4zgy4sfza0eqwic7wqavc with public set to true
If you need to modify the saved query, run:
$ webhookdb saved-query update --field=sql svq_m7c4zgy4sfza0eqwic7wqavc
Render your map
Let’s see what our results look like:
$ webhookdb saved-query list
Look at the RUN URL column, and copy the URL, and pass it to curl.
Or we can fetch it inline:
$ curl webhookdb saved-query info --field=run_url svq_m7c4zgy4sfza0eqwic7wqavc
That should print out the response, with the shape {"rows": []}.
If that’s all working, we can put our map together.
Our map is a single index.html file with inline CSS and JavaScript. You can find the full code here: https://github.com/webhookdb/pdxreporter-map
Here is the simplified version:
<!DOCTYPE html>
<html>
<head>
<!-- Get this code from https://github.com/webhookdb/pdxreporter-map -->
<meta charset="utf-8">
<title>PDX Reporter Map | BikeLoud PDX</title>
<meta name="viewport" content="initial-scale=1,maximum-scale=1,user-scalable=no">
<link href="https://api.mapbox.com/mapbox-gl-js/v3.1.2/mapbox-gl.css" rel="stylesheet">
<script src="https://api.mapbox.com/mapbox-gl-js/v3.1.2/mapbox-gl.js"></script>
<style>
body { margin: 0; padding: 0; }
#map { position: absolute; top: 0; bottom: 0; width: 100%; }
.marker {
font-size: 14px;
background-color: rgba(255, 255, 255, 50%);
border-radius: 50%;
padding: 2px;
border: rgba(0, 0, 0, 30%) 1px solid;
}
.mapboxgl-popup-content {
border-radius: 6px;
}
</style>
</head>
<body>
<div id="map"></div>
<script>
mapboxgl.accessToken = 'pk.eyJ1Ijoicm9ibGl0aGljIiwiYSI6ImNsczg3ajY1dzF5bnkya24yeWp5ZHl6ajEifQ.k-7Aez1RUjOQEL1kEQDF1Q';
const map = new mapboxgl.Map({
container: 'map', // container ID
center: [-122.676483, 45.523064], // starting position [lng, lat]
zoom: 12 // starting zoom
});
(async function() {
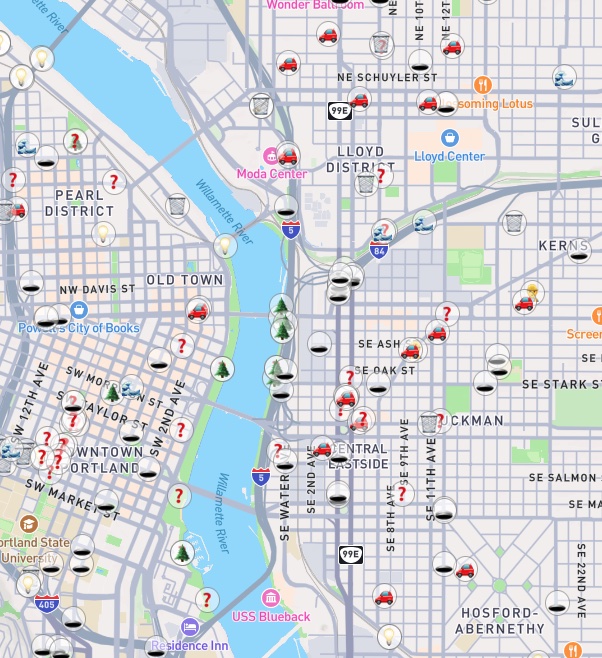
const categoryEmoji = {
'Debris in Roadway': '🗑️',
'Street Lighting': '💡',
'Potholes': '🕳️',
'Plugged Storm Drain/Inlet': '🌊',
'Illegal Parking': '🚗',
'Sewer Cleaning': '💩',
}
// See https://docs.webhookdb.com/guides/render-map/ to get your own URL for your own feed or database
const webhookdbSavedQueryUrl = 'https://api.webhookdb.com/v1/saved_queries/svq_23en3z2idq56ktlc2ivb4x6ri/run'
const resp = await fetch(webhookdbSavedQueryUrl);
const body = await resp.json();
body.rows.forEach((row) => {
// Will give an object with keys like: title, published, geo_lat, geo_lng, status, address, comment
// If the query changes the selected column names, we need to change this.
const rowObj = {};
body.headers.forEach((h, i) => {
rowObj[h] = row[i];
});
const popupHtml = `<h2>${rowObj.title}</h2><p>${rowObj.comment || ''}</p><p>At: ${rowObj.published}<br />Status: ${rowObj.status}<br />ID: ${rowObj.entry_id}</p>`
const popup = new mapboxgl.Popup({ offset: 12 }).setHTML(popupHtml)
const el = document.createElement('div');
el.classList.add('marker');
el.innerHTML = `${categoryEmoji[rowObj.category] || '❓'}`;
new mapboxgl.Marker(el)
.setLngLat([rowObj.geo_lng, rowObj.geo_lat])
.setPopup(popup)
.addTo(map);
})
})()
</script>
</body>
</html>
Find the UI code for this tutorial at https://github.com/webhookdb/pdxreporter-map.